NAV as of 5/3/2024
$111.85
1 Day NAV Change as of 5/3/2024
$0.86

| Symbol | Exchange | Inception Date | CUSIP |
|---|---|---|---|
| SURE | NYSE Arca | 10/4/2011 | 00768Y818 |

<strong>About the ETF</strong>
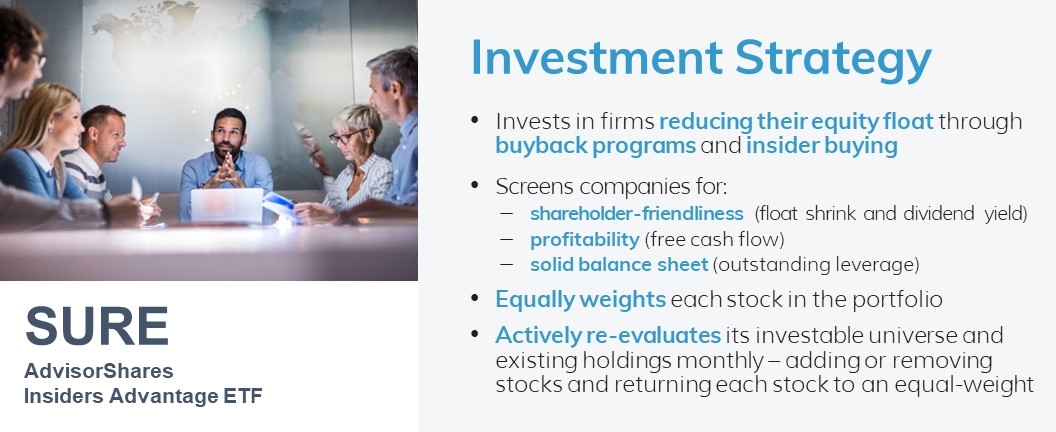
Following a core investment philosophy that corporate insiders know their companies the best, the AdvisorShares Insider Advantage ETF (SURE) seeks to invest in the equities of companies actively trying to reduce their public equity float through well-executed stock buyback programs and corporate insider buying. Not only do buybacks and insider buying demonstrate that executives may see relative value in the firm’s stock, they also could create favorable shareholder market conditions through the reduction of publicly available shares (float shrink). SURE selects holdings using an active, quantitative, multi-factor model to identify companies shrinking float, lowering leverage, growing free cash flow, and providing dividends. SURE’s holdings are equal-weighted and reconstituted/rebalanced monthly.
<strong>What Is Float Shrink?</strong>
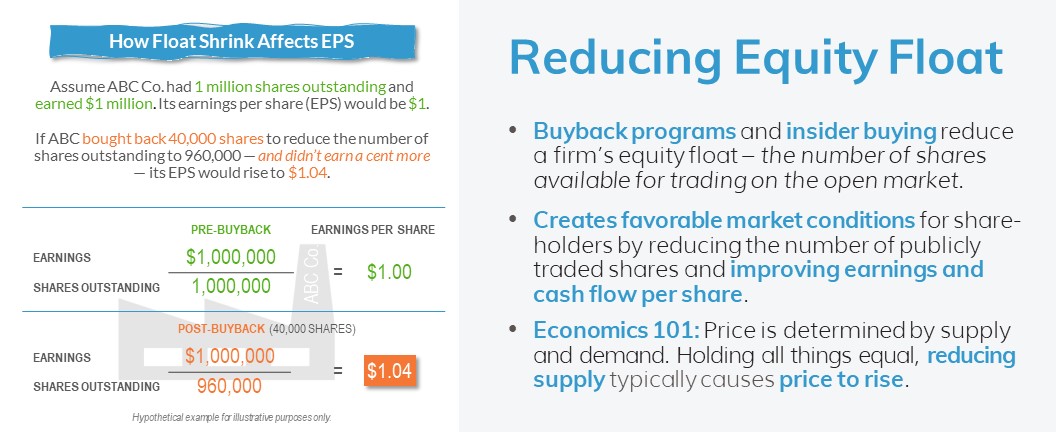
Public equity float refers to the portion of a company’s outstanding shares that is in the hands of public investors – as opposed to company officers, directors, or stockholders that hold controlling interests – and are available for trading in the open market. The float is calculated by subtracting restricted shares from outstanding shares. Float shrink occurs when there is a reduction of publicly available shares.
Buybacks – action taken by a corporation to repurchase its own shares from the marketplace – are the most common cause of float shrink today and one of two ways a company can distribute profits to shareholders. Dividend payments are the second form. While firms may implement both, since 1997, share buybacks have surpassed cash dividends to become the dominant form of corporate payout in the U.S. Not only do buybacks avoid a stock price penalty if a firm cuts or ends a program, like dividends are subject to, but also provide a positive market impact by improving earnings and cash flow per share.
Insider buying – the purchase of shares in a corporation by a board member, officer, or executive within that company (i.e., corporate insider) – is another way that float shrink occurs. It may be a strong indicator that insiders are becoming more optimistic about the company’s future. Buying by corporate insiders is legal, highly regulated, publicly disclosed, and different from “insider trading” – the illegal act of buying or selling stock by someone who has privileged, non-public information about a company.
<strong>Why Invest?</strong>
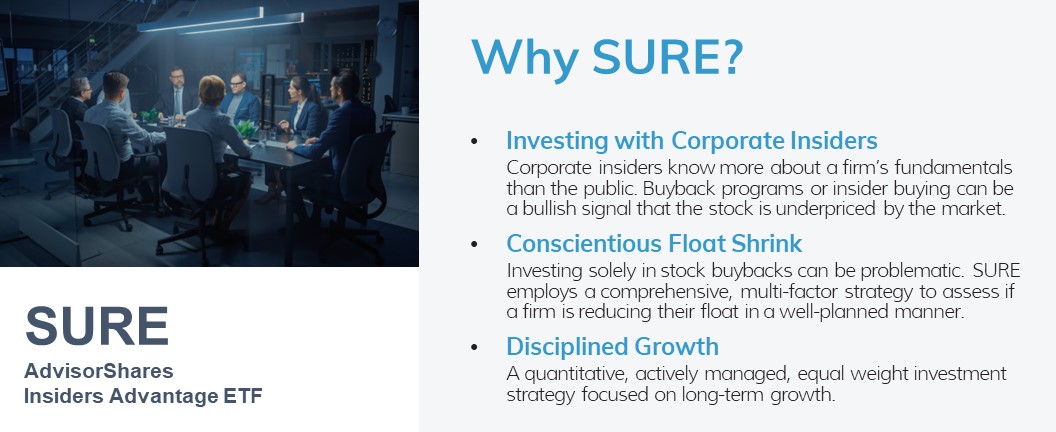
- Investing with Corporate Insiders – Top firm executives know more about the company’s fundamentals than the investing public. These insiders can influence their company’s share price by timing equity issuance and repurchase to the firm’s advantage. A well-implemented buyback program reduces publicly available shares and can increase the stock’s price. Additionally, corporate insider buying can be a bullish signal that the stock is underpriced by the market.
- Conscientious Float Shrink – Investing solely in stock buybacks can be problematic. SURE employs a comprehensive, multi-factor strategy to assess if a firm is reducing their float in a well-planned manner, analyzing free cash flow, profitability, leverage reduction, dividend yield, net buybacks and insider buying.
- Disciplined Growth – A quantitative, actively managed, equal weight investment strategy focused on long-term growth.
<strong>Key Attributes</strong>
- Float Shrink – Corporate insiders have better information than the investing public and know their companies the best. Stock buyback programs and insider buying not only show that corporate insiders see relative value in investing in their own equity securities, but also create favorable market conditions for shareholders by reducing the number of publicly traded shares and improving earnings and cash flow per share.
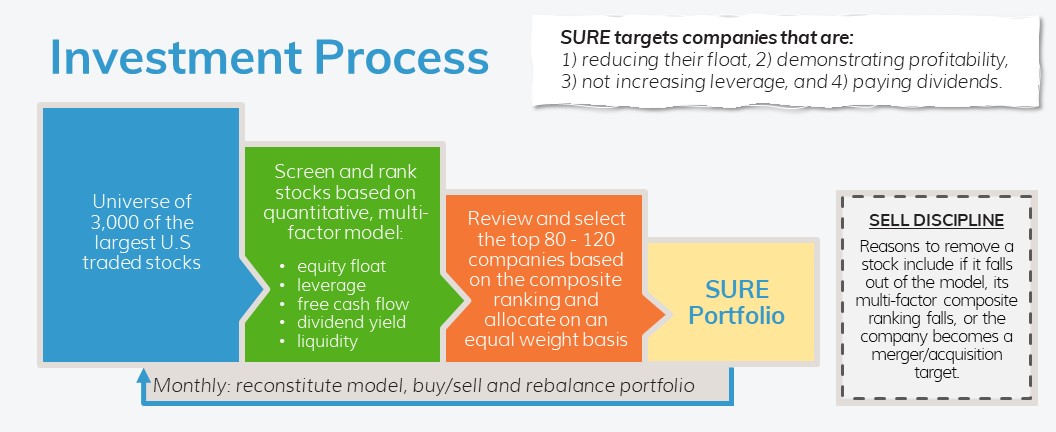
- Extensive Stock Screening – SURE’s portfolio manager screens approximately 3,000 companies and looks for the following characteristics when selecting stocks: shareholder-friendliness (measured by float shrink and dividend yield), profitability (measured by free cash flow), solid balance sheet (measured by outstanding leverage).
- Equal Weight Investing – In a market-cap weighted portfolio, a small number of the largest companies receive the heaviest allocations and overvalued components are overweighted relative to undervalued components. By contrast, with an equal weight strategy, the bias to the largest companies is removed; a buy low, sell high discipline is regularly followed with periodic rebalancing; and reallocation to undervalued stocks may provide the opportunity to capture long-term equity performance.
- Actively Managed ETF Structure – SURE is different from other buyback-focused investments that follow passive, market-cap weighted indexes and only reconstitute annually. SURE re-evaluates its investable universe and existing holdings monthly – adding or removing stocks and returning each security to an equal-weight allocation – allowing SURE to react more quickly to changes in buyback programs, acquisition announcements, etc. An ETF structure allows for better tax efficiency than mutual funds or than investing in the underlying stocks directly.
<strong>Where Can SURE Fit in a Traditional Portfolio?</strong>
SURE can serve as a thematic investment or a complement to a dividend investing or market-cap weighted core strategy.
<strong>About the Portfolio Strategist</strong>
Minyi Chen, Portfolio Strategist
Minyi Chen, CFA is the founder and CEO of Qubed Capital, a registered investment advisor founded in 2015 and based in Oakland, California. For over a decade, Mr. Chen has been providing quantitative financial research and analysis along with proprietary investment models to both retail and institutional investors. In the past, Mr. Chen has served as a portfolio manager of the AdvisorShares TrimTabs Float Shrink ETF (ticker: TTFS) and the TrimTabs International Free-Cash-Flow ETF (ticker: FCFI).
SURE Overview
Get a quick and easy introduction to the SURE ETF.
SURE Overview
Get a quick and easy introduction to the SURE ETF.
Fund
Price History
Fund Data
5/3/2024| NAV | $111.85 |
| Change | $0.86 |
| Shares Outstanding | 425,000 |
| Assets Under Management | $47,537,409.9 |
Market Data
5/3/2024| Closing Price | $111.84 |
| Close Change | $1.08 |
| Volume | 35 |
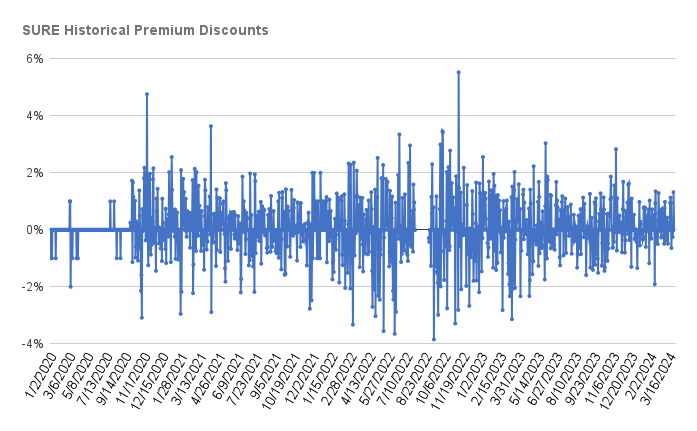
Regulatory Data
5/3/2024| Premium Discount | $-0.040 |
| 30-Day Median bid-ask Spread | 0 |
Shares are bought and sold at market price (closing price) not NAV and are not individually redeemed from the Fund. Market price returns are based on the midpoint of the bid/ask spread at 4:00 pm Eastern Time (when NAV is normally determined), and do not represent the return you would receive if you traded at other times.
FUND
Characteristics
As of 4/30/2024
SURE Market Capitalization
Source: Morningstar & AdvisorShares
SURE Sector Allocation
FUND
Performance
As of 3/31/2024
| NAV | Market Price Return | Russell 1000 Value | Russell 3000 Index | |
|---|---|---|---|---|
| 1 Month | 5.39 | 5.33 | 5.00 | 3.23 |
| 3 Months | 11.84 | 11.72 | 8.99 | 10.02 |
| YTD | 11.84 | 11.72 | 8.99 | 10.02 |
| 1 Year | 31.52 | 31.47 | 20.27 | 29.29 |
| 3 Years | 10.55 | 10.63 | 8.11 | 9.75 |
| 5 Years | 13.68 | 13.66 | 10.32 | 14.32 |
| Since Inception (10/04/2011, Annualized) | 13.80 | 13.80 | 12.46 | 14.98 |
As of 3/31/2024
| NAV | Market Price Return | Russell 1000 Value | Russell 3000 Index | |
|---|---|---|---|---|
| 1 Month | 5.39 | 5.33 | 5 | 3.23 |
| 3 Months | 11.84 | 11.72 | 8.99 | 10.02 |
| YTD | 11.84 | 11.72 | 8.99 | 10.02 |
| 1 Year | 31.52 | 31.47 | 20.27 | 29.29 |
| 3 Years | 10.55 | 10.63 | 8.11 | 9.75 |
| 5 Years | 13.68 | 13.66 | 10.32 | 14.32 |
| Since Inception (10/04/2011, Annualized) | 13.8 | 13.8 | 12.46 | 14.98 |
As of 3/31/2024
| NAV | Market Price Return | Russell 1000 Value | Russell 3000 Index | |
|---|---|---|---|---|
| 1 Month | 5.39 | 5.33 | 5.00 | 3.23 |
| 3 Months | 11.84 | 11.72 | 8.99 | 10.02 |
| YTD | 11.84 | 11.72 | 8.99 | 10.02 |
| 1 Year | 31.52 | 31.47 | 20.27 | 29.29 |
| Since 9/1/2022, Annualized | 22.78 | 22.94 | 14.74 | 34.73 |
Performance data quoted represents past performance and is no guarantee of future results. All Fund data and performance data quoted is believed to be accurate, and unless otherwise stated, is sourced from the Fund administrator, the Advisor’s or Sub-Advisor’s proprietary data, and Morningstar. Current performance may be lower or higher than the performance data quoted. Investment return and principal value will fluctuate so that an investor’s shares, when redeemed, may be worth more or less than original cost. Returns less than one year are not annualized.
*On September 1, 2022, the AdvisorShares DoubleLine Value Equity ETF (the “Predecessor Fund”) was renamed the AdvisorShares Insider Advantage ETF. The Predecessor Fund had different portfolio managers and investment strategy than the AdvisorShares Insider Advantage ETF. Performance prior to September 1, 2022 reflects the Fund’s performance prior to the change in manager and investment strategy and may not be indicative of the Fund’s performance under the new manager and revised investment strategy. Performance since September 1, 2022 reflects actual AdvisorShares Insider Advantage ETF performance.
Performance data quoted represents past performance and is no guarantee of future results. All Fund data and performance data quoted is believed to be accurate, and unless otherwise stated, is sourced from the Fund administrator, the Advisor’s or Sub-Advisor’s proprietary data, and Morningstar. Current performance may be lower or higher than the performance data quoted. Investment return and principal value will fluctuate so that an investor’s shares, when redeemed, may be worth more or less than original cost. Returns less than one year are not annualized. One cannot invest directly in an index. The Russell 1000 Index represents the top 1000 companies by market capitalization in the United States. The index is a subset of the Russell 3000 Index. The Russell 3000 Index is broad market, capitalization-weighted index comprised of the largest 3,000 U.S. companies and represents 98% of the investable U.S. equity market.
Fund
Holdings
As of
| Date | Account Symbol | Stock Ticker | Security ID | Security Description | Shares | Share Price | Market Value | Portfolio Weight | Asset Group |
|---|---|---|---|---|---|---|---|---|---|
| 05/03/2024 | SURE | VST | 92840M102 | VISTRA CORP | 6,839.00 | 81.49 | 557,310.11 | 1.17% | S |
| RMD | 761152107 | RESMED INC | 2,560.00 | 216.98 | 555,468.80 | 1.17% | S | ||
| LDOS | 525327102 | LEIDOS HOLDINGS INC | 3,706.00 | 141.67 | 525,029.02 | 1.10% | S | ||
| CTS | 126501105 | CTS CORP | 10,576.00 | 49.59 | 524,463.84 | 1.10% | S | ||
| AAPL | 037833100 | APPLE INC | 2,821.00 | 183.38 | 517,314.98 | 1.09% | S | ||
| WAB | 929740108 | WABTEC CORP | 3,183.00 | 162.21 | 516,314.43 | 1.09% | S | ||
| WING | 974155103 | WINGSTOP INC | 1,315.00 | 388.55 | 510,943.25 | 1.07% | S | ||
| TT | G8994E103 | TRANE TECHNOLOGIES PLC | 1,596.00 | 319.29 | 509,586.84 | 1.07% | FS | ||
| DPZ | 25754A201 | DOMINO'S PIZZA INC | 988 | 514.33 | 508,158.04 | 1.07% | S | ||
| NRG | 629377508 | NRG ENERGY INC | 6,622.00 | 76.65 | 507,576.30 | 1.07% | S | ||
| KLAC | 482480100 | KLA CORP | 724 | 696.59 | 504,331.16 | 1.06% | S | ||
| CW | 231561101 | CURTISS-WRIGHT CORP | 1,878.00 | 268.17 | 503,623.26 | 1.06% | S | ||
| VSEC | 918284100 | VSE CORP | 6,059.00 | 82.9 | 502,291.10 | 1.06% | S | ||
| OC | 690742101 | OWENS CORNING | 2,866.00 | 174.81 | 501,005.46 | 1.05% | S | ||
| MCHP | 595017104 | MICROCHIP TECHNOLOGY INC | 5,456.00 | 91.36 | 498,460.16 | 1.05% | S | ||
| DD | 26614N102 | DUPONT DE NEMOURS INC | 6,405.00 | 77.67 | 497,476.35 | 1.05% | S | ||
| CSL | 142339100 | CARLISLE COS INC | 1,247.00 | 398.47 | 496,892.09 | 1.05% | S | ||
| UTZ | 918090101 | UTZ BRANDS INC | 25,796.00 | 19.24 | 496,315.04 | 1.04% | S | ||
| AMAT | 038222105 | APPLIED MATERIALS INC | 2,431.00 | 204.09 | 496,142.79 | 1.04% | S | ||
| BGC | 088929104 | BGC GROUP INC-A | 60,261.00 | 8.22 | 495,345.42 | 1.04% | S | ||
| KBH | 48666K109 | KB HOME | 7,185.00 | 68.78 | 494,184.30 | 1.04% | S | ||
| GHC | 384637104 | GRAHAM HOLDINGS CO-CLASS B | 672 | 732.68 | 492,360.96 | 1.04% | S | ||
| CL | 194162103 | COLGATE-PALMOLIVE CO | 5,294.00 | 92.88 | 491,706.72 | 1.03% | S | ||
| IDCC | 45867G101 | INTERDIGITAL INC | 4,744.00 | 103.64 | 491,668.16 | 1.03% | S | ||
| BDC | 077454106 | BELDEN INC | 5,564.00 | 88.23 | 490,911.72 | 1.03% | S | ||
| EXP | 26969P108 | EAGLE MATERIALS INC | 1,878.00 | 261.12 | 490,383.36 | 1.03% | S | ||
| TOL | 889478103 | TOLL BROTHERS INC | 3,963.00 | 123.63 | 489,945.69 | 1.03% | S | ||
| PJT | 69343T107 | PJT PARTNERS INC - A | 4,912.00 | 99.53 | 488,891.36 | 1.03% | S | ||
| BWXT | 05605H100 | BWX TECHNOLOGIES INC | 5,021.00 | 97.34 | 488,744.14 | 1.03% | S | ||
| PHM | 745867101 | PULTEGROUP INC | 4,190.00 | 116.64 | 488,721.60 | 1.03% | S | ||
| CTVA | 22052L104 | CORTEVA INC | 8,490.00 | 57.16 | 485,288.40 | 1.02% | S | ||
| GE | 369604301 | GENERAL ELECTRIC CO | 2,955.00 | 164.11 | 484,945.05 | 1.02% | S | ||
| LEN | 526057104 | LENNAR CORP-A | 3,064.00 | 158.1 | 484,418.40 | 1.02% | S | ||
| LRCX | 512807108 | LAM RESEARCH CORP | 533 | 908.53 | 484,246.49 | 1.02% | S | ||
| CMC | 201723103 | COMMERCIAL METALS CO | 8,648.00 | 55.9 | 483,423.20 | 1.02% | S | ||
| MTG | 552848103 | MGIC INVESTMENT CORP | 23,205.00 | 20.64 | 478,951.20 | 1.01% | S | ||
| EA | 285512109 | ELECTRONIC ARTS INC | 3,681.00 | 129.56 | 476,910.36 | 1.00% | S | ||
| SCS | 858155203 | STEELCASE INC-CL A | 38,052.00 | 12.49 | 475,269.48 | 1.00% | S | ||
| SM | 78454L100 | SM ENERGY CO | 9,480.00 | 50.13 | 475,232.40 | 1.00% | S | ||
| NMRK | 65158N102 | NEWMARK GROUP INC-CLASS A | 47,541.00 | 9.99 | 474,934.59 | 1.00% | S | ||
| TRS | 896215209 | TRIMAS CORP | 18,057.00 | 26.21 | 473,273.97 | 1.00% | S | ||
| PVH | 693656100 | PVH CORP | 4,171.00 | 113.22 | 472,240.62 | 0.99% | S | ||
| STLD | 858119100 | STEEL DYNAMICS INC | 3,479.00 | 135.47 | 471,300.13 | 0.99% | S | ||
| BCC | 09739D100 | BOISE CASCADE CO | 3,459.00 | 136.05 | 470,596.95 | 0.99% | S | ||
| AYI | 00508Y102 | ACUITY BRANDS INC | 1,848.00 | 254.41 | 470,149.68 | 0.99% | S | ||
| CHD | 171340102 | CHURCH & DWIGHT CO INC | 4,428.00 | 106.11 | 469,855.08 | 0.99% | S | ||
| RYAN | 78351F107 | RYAN SPECIALTY HOLDINGS INC | 9,123.00 | 51.5 | 469,834.50 | 0.99% | S | ||
| HLT | 43300A203 | HILTON WORLDWIDE HOLDINGS IN | 2,378.00 | 197.54 | 469,750.12 | 0.99% | S | ||
| RL | 751212101 | RALPH LAUREN CORP | 2,817.00 | 166.64 | 469,424.88 | 0.99% | S | ||
| TMO | 883556102 | THERMO FISHER SCIENTIFIC INC | 820 | 572.38 | 469,351.60 | 0.99% | S | ||
| RTX | 75513E101 | RTX CORP | 4,626.00 | 101.4 | 469,076.40 | 0.99% | S | ||
| AWI | 04247X102 | ARMSTRONG WORLD INDUSTRIES | 4,052.00 | 115.61 | 468,451.72 | 0.99% | S | ||
| OLN | 680665205 | OLIN CORP | 8,731.00 | 53.63 | 468,243.53 | 0.99% | S | ||
| GM | 37045V100 | GENERAL MOTORS CO | 10,407.00 | 44.86 | 466,858.02 | 0.98% | S | ||
| WU | 959802109 | WESTERN UNION CO | 34,889.00 | 13.37 | 466,465.93 | 0.98% | S | ||
| AMG | 008252108 | AFFILIATED MANAGERS GROUP | 2,906.00 | 160.35 | 465,977.10 | 0.98% | S | ||
| WRB | 084423102 | WR BERKLEY CORP | 5,930.00 | 78.56 | 465,860.80 | 0.98% | S | ||
| KLG | 92942W107 | WK KELLOGG CO | 20,064.00 | 23.2 | 465,484.80 | 0.98% | S | ||
| SPG | 828806109 | SIMON PROPERTY GROUP INC | 3,252.00 | 142.93 | 464,808.36 | 0.98% | S | ||
| ASH | 044186104 | ASHLAND INC | 4,843.00 | 95.85 | 464,201.55 | 0.98% | S | ||
| GNTX | 371901109 | GENTEX CORP | 13,590.00 | 34.13 | 463,826.70 | 0.98% | S | ||
| LNG | 16411R208 | CHENIERE ENERGY INC | 2,940.00 | 157.54 | 463,167.60 | 0.97% | S | ||
| POOL | 73278L105 | POOL CORP | 1,265.00 | 364.65 | 461,282.25 | 0.97% | S | ||
| AXP | 025816109 | AMERICAN EXPRESS CO | 1,996.00 | 230.77 | 460,616.92 | 0.97% | S | ||
| V | 92826C839 | VISA INC-CLASS A SHARES | 1,715.00 | 268.49 | 460,460.35 | 0.97% | S | ||
| MAR | 571903202 | MARRIOTT INTERNATIONAL -CL A | 1,961.00 | 234.59 | 460,030.99 | 0.97% | S | ||
| HIG | 416515104 | HARTFORD FINANCIAL SVCS GRP | 4,695.00 | 97.9 | 459,640.50 | 0.97% | S | ||
| NUE | 670346105 | NUCOR CORP | 2,640.00 | 173.92 | 459,148.80 | 0.97% | S | ||
| ROST | 778296103 | ROSS STORES INC | 3,509.00 | 130.84 | 459,117.56 | 0.97% | S | ||
| JBL | 466313103 | JABIL INC | 3,914.00 | 117.22 | 458,799.08 | 0.97% | S | ||
| WYNN | 983134107 | WYNN RESORTS LTD | 4,744.00 | 96.71 | 458,792.24 | 0.97% | S | ||
| MGY | 559663109 | MAGNOLIA OIL & GAS CORP - A | 18,196.00 | 25.11 | 456,901.56 | 0.96% | S | ||
| HCA | 40412C101 | HCA HEALTHCARE INC | 1,483.00 | 307.76 | 456,408.08 | 0.96% | S | ||
| EBAY | 278642103 | EBAY INC | 9,192.00 | 49.65 | 456,382.80 | 0.96% | S | ||
| GWW | 384802104 | WW GRAINGER INC | 489 | 931.94 | 455,718.66 | 0.96% | S | ||
| DOX | G02602103 | AMDOCS LTD | 5,426.00 | 83.9 | 455,241.40 | 0.96% | FS | ||
| EOG | 26875P101 | EOG RESOURCES INC | 3,499.00 | 130.02 | 454,939.98 | 0.96% | S | ||
| SHO | 867892101 | SUNSTONE HOTEL INVESTORS INC | 44,477.00 | 10.19 | 453,220.63 | 0.95% | S | ||
| CI | 125523100 | THE CIGNA GROUP | 1,327.00 | 341.5 | 453,170.50 | 0.95% | S | ||
| MA | 57636Q104 | MASTERCARD INC - A | 1,019.00 | 443.58 | 452,008.02 | 0.95% | S | ||
| LBRT | 53115L104 | LIBERTY ENERGY INC | 20,855.00 | 21.64 | 451,302.20 | 0.95% | S | ||
| OXY | 674599105 | OCCIDENTAL PETROLEUM CORP | 6,996.00 | 64.39 | 450,472.44 | 0.95% | S | ||
| MRO | 565849106 | MARATHON OIL CORP | 17,000.00 | 26.34 | 447,780.00 | 0.94% | S | ||
| VLO | 91913Y100 | VALERO ENERGY CORP | 2,840.00 | 156.84 | 445,425.60 | 0.94% | S | ||
| WST | 955306105 | WEST PHARMACEUTICAL SERVICES | 1,216.00 | 365.02 | 443,864.32 | 0.93% | S | ||
| COP | 20825C104 | CONOCOPHILLIPS | 3,627.00 | 122.23 | 443,328.21 | 0.93% | S | ||
| MUSA | 626755102 | MURPHY USA INC | 1,129.00 | 392.44 | 443,064.76 | 0.93% | S | ||
| TEX | 880779103 | TEREX CORP | 7,591.00 | 58.35 | 442,934.85 | 0.93% | S | ||
| ALSN | 01973R101 | ALLISON TRANSMISSION HOLDING | 5,901.00 | 74.06 | 437,028.06 | 0.92% | S | ||
| CAT | 149123101 | CATERPILLAR INC | 1,295.00 | 336.75 | 436,091.25 | 0.92% | S | ||
| PBF | 69318G106 | PBF ENERGY INC-CLASS A | 8,376.00 | 51.86 | 434,379.36 | 0.91% | S | ||
| BG | H11356104 | BUNGE GLOBAL SA | 4,289.00 | 101.15 | 433,832.35 | 0.91% | FS | ||
| META | 30303M102 | META PLATFORMS INC-CLASS A | 959 | 451.96 | 433,429.64 | 0.91% | S | ||
| MPC | 56585A102 | MARATHON PETROLEUM CORP | 2,374.00 | 182.55 | 433,373.70 | 0.91% | S | ||
| PSX | 718546104 | PHILLIPS 66 | 2,985.00 | 143.61 | 428,675.85 | 0.90% | S | ||
| AON | G0403H108 | AON PLC-CLASS A | 1,502.00 | 279.97 | 420,514.94 | 0.88% | FS | ||
| BMY | 110122108 | BRISTOL-MYERS SQUIBB CO | 9,507.00 | 43.99 | 418,212.93 | 0.88% | S | ||
| WNC | 929566107 | WABASH NATIONAL CORP | 17,870.00 | 23.34 | 417,085.80 | 0.88% | S | ||
| HOG | 412822108 | HARLEY-DAVIDSON INC | 11,821.00 | 35.05 | 414,326.05 | 0.87% | S | ||
| ODFL | 679580100 | OLD DOMINION FREIGHT LINE | 2,174.00 | 185.06 | 402,320.44 | 0.85% | S | ||
| X9USDBLYT | BLACKROCK TREASURY TRUST INSTL 62 | 287,516.29 | 1 | 287,516.29 | 0.60% | MM | |||
| CASH | 106,764.84 | 100 | 106,764.84 | 0.22% | CA |
FUND
Fees & Expenses
| Management Fee | 0.70% |
| Total Annual Operating Expenses | 1.05% |
| Fee Waiver/Expense Reimbursement* | -0.15% |
| Total Annual Operating Expenses After Waiver/Reimbursement | 0.90% |
*The Advisor has contractually agreed to keep net expenses from exceeding 0.90% of the Fund’s average daily net assets for at least one year from the date of the prospectus. For more information, please read the full prospectus.

Last Ten
Fund Distributions
- Before investing you should carefully consider the Fund’s investment objectives, risks, charges and expenses. This and other information is in the prospectus, a copy of which may be obtained by visiting the Fund’s website at www.AdvisorShares.com. Please read the prospectus carefully before you invest. Foreside Fund Services, LLC, Distributor.
- The Fund’s investment focus follows a core philosophy that corporate insiders know their companies best. The Advisor believes that insider buying and stock buyback programs not only show that corporate insiders see relative value in investing in their own company’s equity securities, but also create favorable market conditions by reducing public equity float (i.e., the share supply available to investors on the public secondary market). The Advisor allocates the Fund’s portfolio using research from a disciplined and quantitative proprietary model, the U.S. Insiders Edge Model, developed by Qubed Capital, LLC. In utilizing the model, the Advisor seeks to remove emotion from day-to-day decision-making by following a systematic process.
- The Fund is an actively-managed exchange-traded fund (“ETF”) that seeks to achieve its investment objective by primarily investing in a portfolio of U.S. traded companies selected from a universe of the largest 3,000 U.S. equity securities based on market capitalization. When models and data prove to be incorrect or incomplete, any decisions made in reliance thereon expose the Fund to potential risks. In addition, the use of predictive models has inherent risk.
- Definitions
A buyback occurs when a company repurchases its own shares from the marketplace, reducing the number of shares outstanding. - Equity float is the portion of a company’s outstanding shares that is in the hands of public investors, as opposed to company officers, directors, or stockholders that hold controlling interests that have trading restrictions.
- Float shrink is a reduction in the number of a company’s shares available for trading.
- Free cash flow represents the cash a company generates after accounting for cash outflows to support operations and maintain its capital assets. It is a measure of profitability and represents the cash available for the company to repay creditors and pay out dividends and interest to investors.
- An insider is an officer, director, executive, entity, or individual that owns more than 10% of a publicly traded company’s shares.
- Insider buying is the legal purchase of shares in a firm by a corporate insider that is not based on non-public, material information and follows the U.S. Securities and Exchange Commission’s rules and reporting requirements.
- Insider trading is the illegal trading a publicly traded company’s security by anyone who has non-public, material information about that security before the information becomes public.
ETF
Social
Conversation